
Furthering anti-racist policy with the Equity Index
Since its creation, the City of Tacoma’s Office of Equity and Human Rights has been central to the City’s commitment to anchor government in anti-racist practices and policies. The Office works for all residents and visitors of Tacoma to make it a place people want to live, work and play.
As part of this charter, the City partnered with the Ohio State University’s Kirwan Institute for the Study of Race and Ethnicity and built a pioneering data tool called the Tacoma Equity Index. The Index helps policymakers more effectively recognize inequity and take measurable steps to combat it. The tool is actively managed by IT and the Strategy Office in the City Manager’s Office to ensure it is used strategically throughout the whole organization and beyond.
The Challenge: Getting the tool in the hands of the community
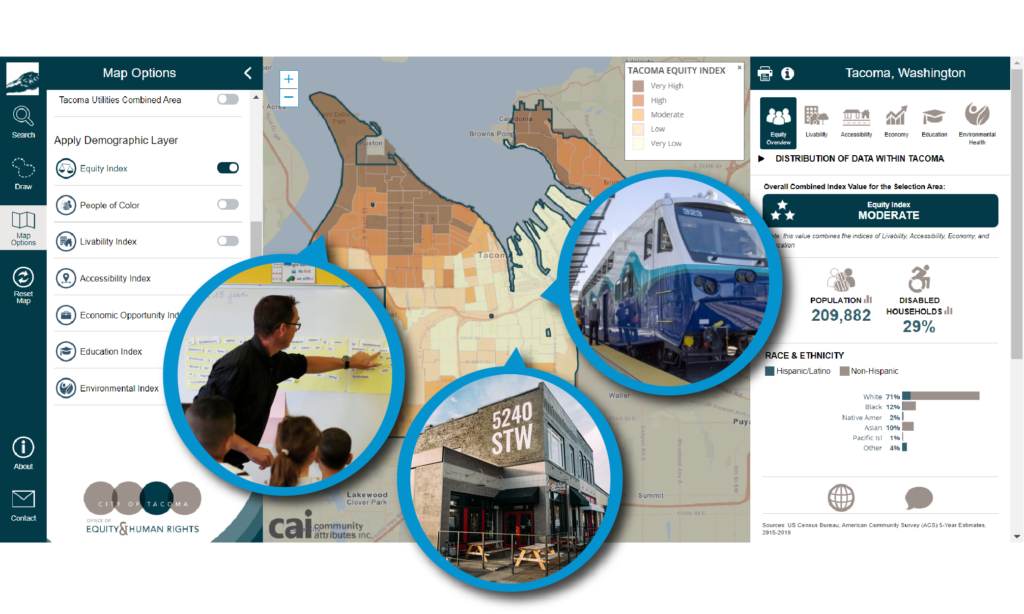
While direct use of geographic information systems is ideal for analysts, if the Equity Index was only accessible to GIS data experts, its usefulness in influencing decisions would be limited. To help their partners in government and beyond more easily access and leverage the Index, the Office chose CAI and its CAI Live platform to create an intuitive, visual application of the tool, the Tacoma Equity Map.
Their primary goal was to improve the process of bringing equity and data into decisions, and maximize the number of programs and policies informed by the Equity Index.
The Approach: Mapping equity gaps
Tacoma project leaders saw the Casey Family Programs Community Opportunity Map, also built on CAI Live, and right away, recognized the opportunity to use the mapping technology to bring the Equity Index to life. A map clearly illustrates how access to resources, inclusion in community initiatives, and targeted public policy vary across a city’s blocks, and it makes a complex set of data much more engaging for community leaders.
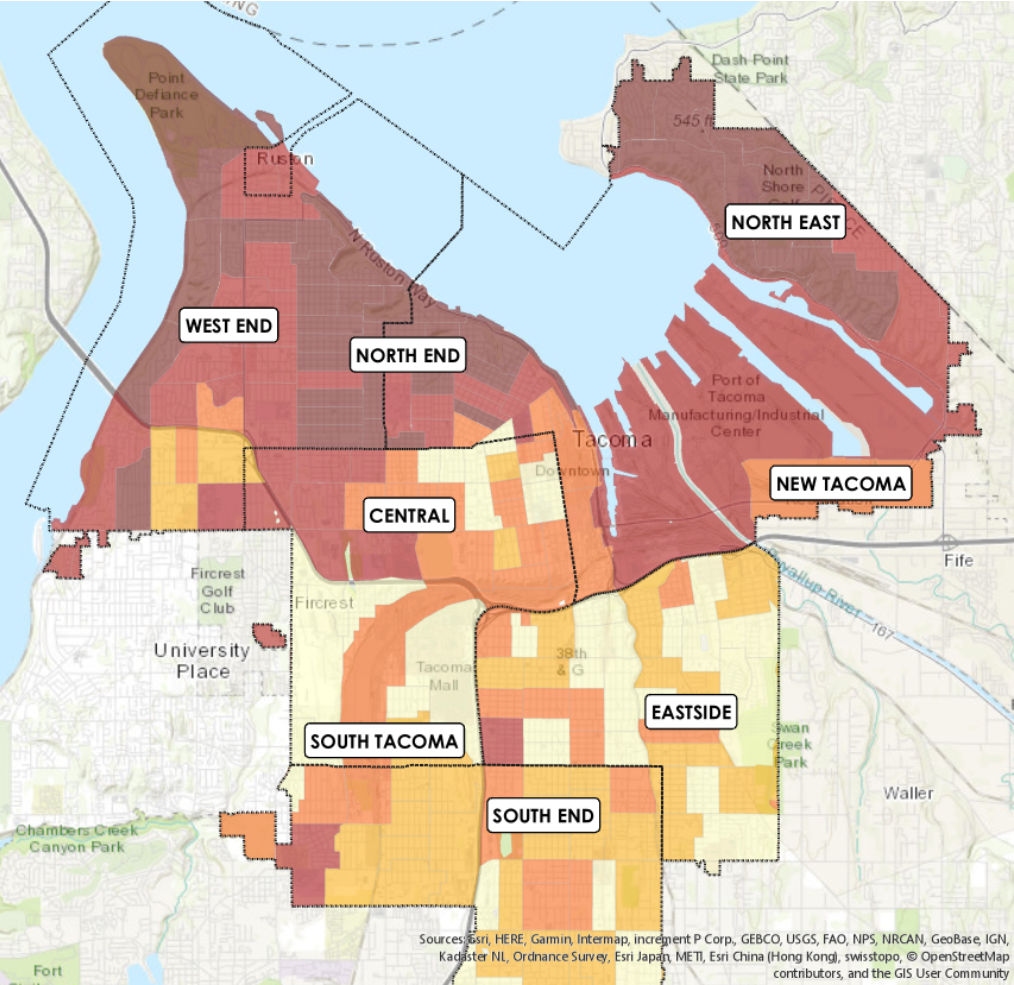
CAI Live’s easy-to-use data layers meant they could also customize the map view (even on the fly!) to help their points hit home with audiences across a range of use cases.
The Result: How CAI Live helps the Equity Index travel further
The Equity Index itself has become a cornerstone of the City of Tacoma’s decision-making process, providing insight on everything from housing investment to COVID-19 relief efforts to street lights, and is used in conversations with city council, neighborhood district meetings, and the public. Because of CAI Live’s interactivity and visual appeal, the Index is a tool government staff reaches for consistently, with access by nearly 200 users a week. Its impact has also traveled far beyond the city limits of Tacoma, becoming a model for other cities and organizations and even drawing the interest of the White House.
“Because there’s so much buy-in, because you can use the same tool with so many audiences, we can act with certainty in so many ways we weren’t able to before.”
Jacques Colon, Strategic Manager, Tacoma 2025
CAI Live’s unique benefit
CAI Live was a game changer for the City of Tacoma because of its intuitive interface, allowing them to flex effortlessly between different uses and audiences to maximize the impact of the Equity Index.
“CAI Live uses data to paint the picture very clearly and gives people the opportunity to make policy decisions and choices that are informed by that data. The tool makes the implicit explicit.”
Jacques Colon, Strategic Manager, Tacoma 2025